Image Credit: NASA Jet Propulsion Laboratory
The impacts of worsening air quality and extreme weather events such as heat waves are increasingly affecting people around the world. How is the air quality in our area affected? Under the direction of Professor Anna Alberini, AGNR undergraduate students Louisa Baltodano, Daniel Jiemba, and Brian Glenn research this issue, advancing the college’s commitment to human and environmental health with their work. Ultimately, while air quality seems to be improving due to new legislation, efforts to curb greenhouse gas emissions still have a long way to go.
Climate change is predicted to increase the frequency, duration and intensity of heat waves in temperature area. This has the potential to worsen air quality as well (figure 1).
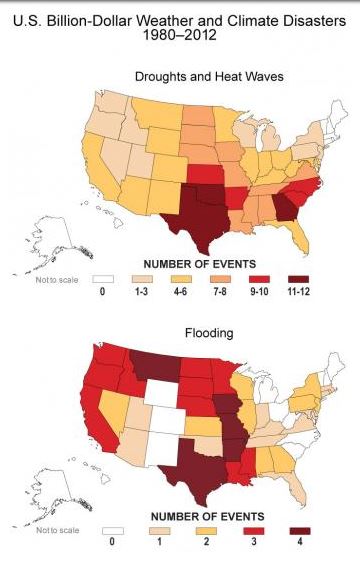
According to the National Oceanic and Atmospheric Administration (NOAA), “during heat waves, the air becomes stagnant and traps emitted pollutants, often resulting in increases in ground level ozone. Heat waves and drought also dry out vegetation and provide more fuel for wildfires whose smoke is a serious medical hazard” (2017). It is known that this increase in extreme heat and droughts coupled with an increase in air pollution has an effect on mortality. According to a report done by an array of scientists and researchers and published in Environmental Health Perspectives, there is “strong evidence that, on average, over all country studies, [278 locations from 12 countries of total durations of 10-40 years between 1972 and 2012] annual mortality was associated with deviations of temperatures from normal, in particular rising in years that experienced long or severe high or low temperatures” (2017).
The Intergovernmental Panel on Climate Change (IPCC) also reports similar findings, noting that a heat wave in London created a “15% increase in all-cause mortality” and that “there is a high level of certainty that an increase in the frequency and intensity of heat waves would increase the number of additional deaths from hot weather” (2017). The IPCC concludes that worsening heat waves will decrease air quality and have long-term effects on mortality across the affected regions in the world (IPCC, 2017).
With alarming trends in climate and air quality around the world, these impacts are also felt in the Metropolitan area close to home. What do the data convey and how are we choosing to tackle issues like worsening air quality due to increased air pollution? In this article, AREC analyzes data from the Metropolitan Washington Council of Governments (WashCog), a “hub for [the] partnership” between over a “thousand officials and experts” that come to “share information and develop solutions to the region’s major challenges” (Metropolitan Washington Council of Governments, 2017). Specifically, WashCog examines air quality data in the region that measure the number of good, moderate, and unhealthy days for sensitive groups. The data are based off of EPA’s Air Quality Index (AQI), which provides “a uniform system of measuring pollution levels for the major air pollutants regulated under the Clean Air Act” (EPA, 2017). The AQI is on a scale from 0 to 500, with levels between 0 and 100 being deemed as “satisfactory” air quality with a low level of ozone and levels above 100 being labeled as potentially unhealthy, with a greater range of people being affected as the number increases (figure 2).
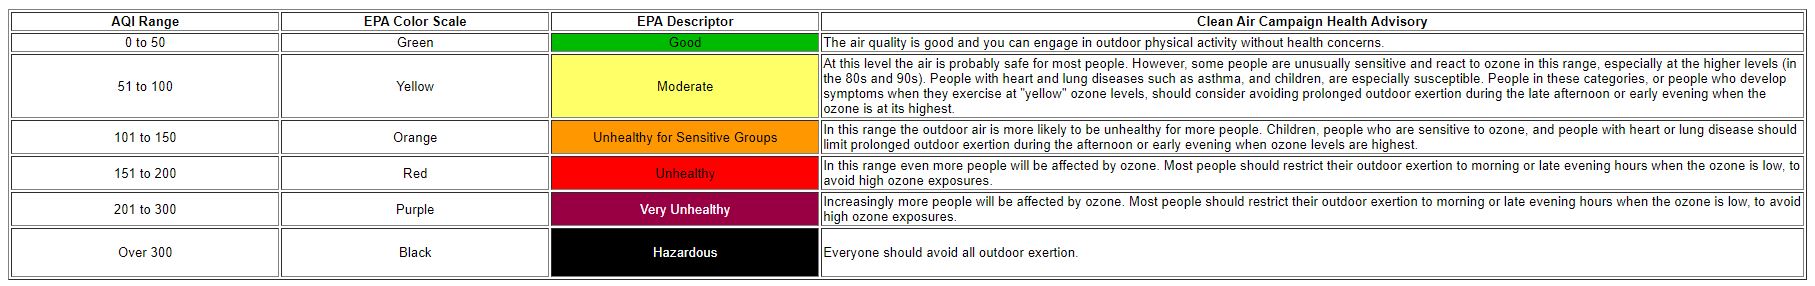
Figure 2: The Pollution Standard Index. Source: U.S. Environmental Protection Agency, Office of Air Quality Planning and Standards, Georgia Environmental Protection Division.
Using these AQI measurements, the team of experts and leaders in the industry within the Washington Council of Governments has extrapolated air quality data over the past 20 years in our region (figure 3 of the graph of air quality days over the past 20 years in the article “No 'Code Red,' fewer 'Code Orange' air quality days recorded in metropolitan Washington” published Sept. 27, 2017).
Analyzing this graph, the Washington Council of Governments is able to conclude that “air quality continues to improve in Metropolitan Washington.” According to Hans Riemer, chair of the Metropolitan Washington Air Quality Committee and Montgomery County Council Member, “we’ve seen a dramatic improvement in the region’s air quality thanks to more than a decade of action and coordination at all levels of government” (2017).
As can be seen in Figure 3, in each of the last five years there have been 14 or fewer days of unhealthful air quality. To add to Riemer’s remarks, the driving force behind the improvement of air quality at a national level is the introduction and revisions of the Clean Air Act. According to the EPA, from 1970-2015 aggregate national emissions from the six common pollutants alone dropped an average of 70 percent while GDP grew by 246 percent” (2017). This Federal legislation was also coupled with local planning and efforts that helped the Metropolitan region achieve this success. There have been various greenhouse gas emission plans and environmental justice plans that have been developed on the local level in the Metropolitan area to tackle the issues of air quality. Although the data show great progress, there is still work to be done, especially on ground-level ozone, which is a colorless gas created when air pollutants react on hot, sunny summer days. The region meets all the standards for Federal health and air quality except with ground-level ozone. Although there has been a general downward trend of ground level ozone, we are still hovering right above the suggested max amount (revised to 70ppb in 2015) (see figure 4).
The Metropolitan area has seen promising increases in air quality due to local and Federal legislation. However, climate change will not be easily reversed, and with it will come more frequent and intense extreme weather events such as heat waves and droughts, which may bring bad air quality episodes. Without a worldwide effort to curb greenhouse gas emissions, the consequences of climate change will continue to plague regions around the world.
Sources:
Georgia Environmental Protection Division: Air Protection Branch, 1994. Information about the Pollution Standard Index. http://www.air.dnr.state.ga.us/information/aqi.html (accessed 12.21.17).
McCarthy, J.J., Intergovernmental Panel on Climate Change. Working Group II., 2001. Climate change 2001 : impacts, adaptation, and vulnerability : contribution of Working Group II to the third assessment report of the Intergovernmental Panel on Climate Change. Cambridge University Press, Cambridge, UK. http://www.ipcc.ch/ipccreports/tar/wg2/index.htm (accessed 12.21.17)
Metropolitan Washington Council of Governments, 2017. No “Code Red,” fewer “Code Orange” air quality days recorded in metropolitan Washington - News Release. https://www.mwcog.org/newsroom/2017/09/27/no-code-red-fewer-code-orange-air-quality-days-recorded-in-metropolitan-washington/ (accessed 12.21.17).
U.S. Department of Commerce, National Oceanic and Atmospheric Administration, National Centers for Environmental Information, 2014. The Impact of Weather and Climate Extremes on Air and Water Quality. https://www.ncdc.noaa.gov/news/impact-weather-and-climate-extremes-air-and-water-quality (accessed 12.21.17).
Related article:
Peterson, T.C., Karl, T.R., Kossin, J.P., Kunkel, K.E., Lawrimore, J.H., McMahon, J.R., Vose, R.S., Yin, X., 2014. Changes in weather and climate extremes: State of knowledge relevant to air and water quality in the United States. Journal of the Air & Waste Management Association 64, 184–197. https://doi.org/10.1080/10962247.2013.851044